File:Fig3 Liscouski AppInfoSciWork21.png
Original file (838 × 678 pixels, file size: 90 KB, MIME type: image/png)
Summary
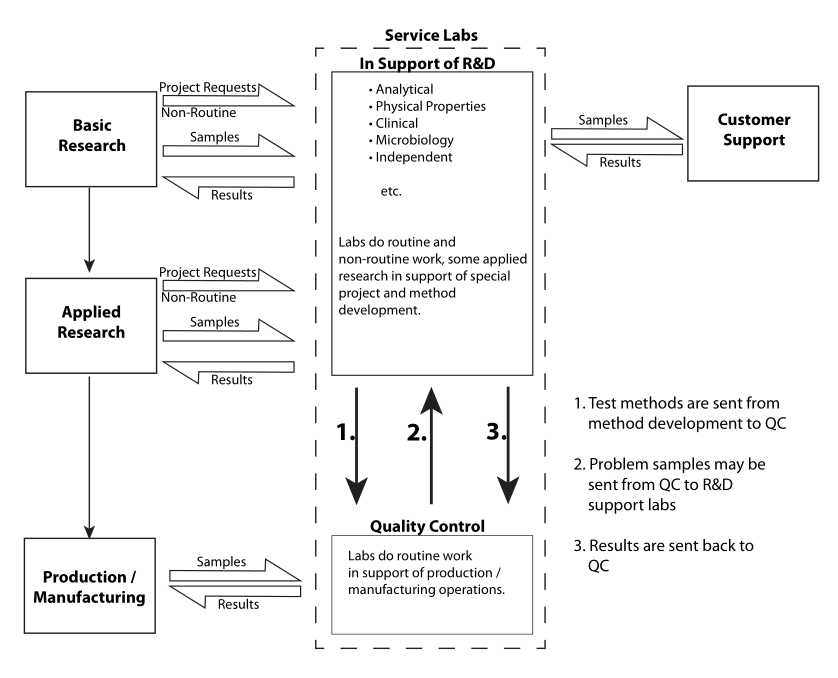
| Description |
Figure 3. This diagram represents one perspective on the relationship between laboratory types. This is a bit simplified, particularly on the roles of research labs. Large research facilities, or those in which waiting for test results impacts the progress of research work, may incorporate a “service lab” function within their operations; the same workflow, just a merger of boxes. The downside of doing that is the loss of independent verification of test results, as people sometimes see what they want to see. This can be addressed by having critical and random samples analyzed independently. |
|---|---|
| Source |
Liscouski, J. (April 2021). "The Application of Informatics to Scientific Work: Laboratory Informatics for Newbies". |
| Date |
2021 |
| Author |
Liscouski, J. |
| Permission (Reusing this file) |
|
| Other versions |
File history
Click on a date/time to view the file as it appeared at that time.
| Date/Time | Thumbnail | Dimensions | User | Comment | |
|---|---|---|---|---|---|
| current | 19:29, 19 June 2024 | | 838 × 678 (90 KB) | Shawndouglas (talk | contribs) |
You cannot overwrite this file.
File usage
The following page uses this file: